
I’m a data nerd and a casual NFL fan. Anyone who watches NFL games knows that broadcasters demonstrate knowledge of the most obscure statistics throughout the game. But there’s one metric that broadcasters don’t have an incentive to tell you:
When is one team so far ahead that there’s a ~zero likelihood of a comeback?
(For the optimists: Tell me if my team still has a chance!)
I decided to answer my own question by building ComebackCeiling.com.
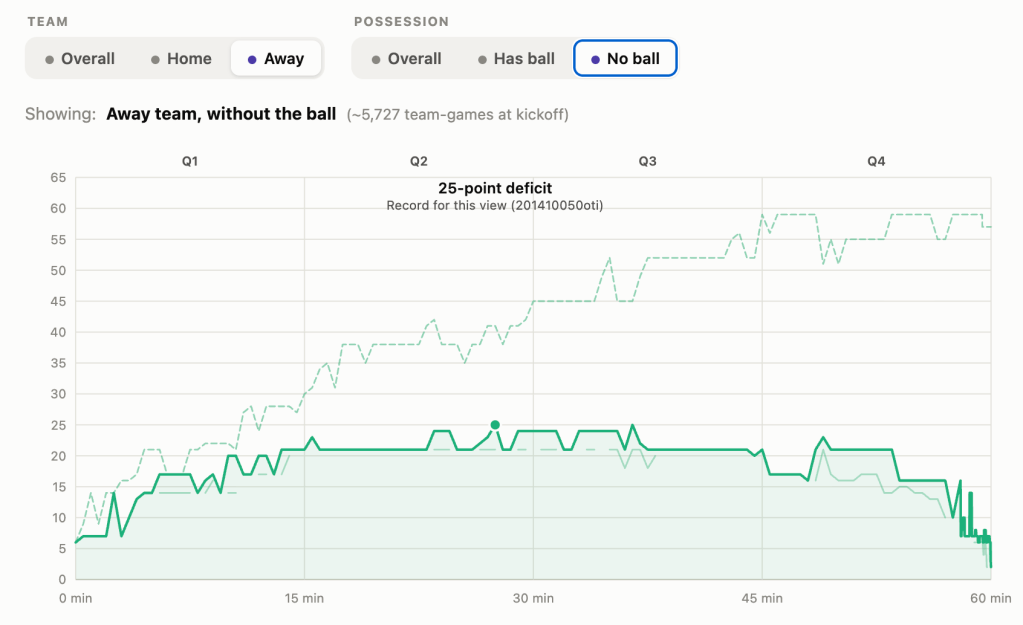
ComebackCeiling has processed >11,000 historical NFL games to identify the point differential between teams – and at each point in the game determine the largest margin that a team has ever come back from to win (or tie/force overtime). Additionally, I’ve calculated how that margin changes based on if the team behind is playing at home or away, and/or possession of the ball. (I also added another line for the largest point differential ever seen at each point in the game.)
I’m launching this now because the NFL season is starts in a matter of days and I want to have this available to me as a fan. 😀 Later this year I hope to spend some time hooking it up to live sources of data and have it tweet when a game has gone past the comeback ceiling. If you have any suggestions, reach out!
Note: I want to credit Gemini and Claude for helping me develop this. Wrangling data and all sorts of different edge cases is fun, but my scripting skills alone are much worse compared to what I can accomplish with the help of AI. (Also, my CSS/JS skills are nonexistent compared to AI!) I wrote a separate (longer) blog post about how I developed the tech behind ComebackCeiling if you’re interested in those details.

